The Observable or Visible Universe, the horizon problem and the age of the universe

Contents

For futher reading

1. The Visible (Observable) Universe and the parameter "age"

The purpose of this document is to answer the Question:
When the age of the Universe increases are we observing more or less galaxies?
Three different Lambda values are considered (With C = 60):
  1. Lambda = 0.0129. This value is close to the present value.
  2. Lambda = 0.06
  3. Lambda = 0. In this case two different C parameters are considered:
    1. C = 60
    2. C = 2
  1. Lambda = 0.0129   C = 60   k = 0

    H0 = 69,992
    1/H0 = 13,999
    Omega(Lambda)=0,73745
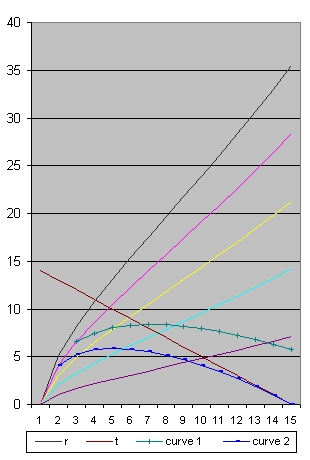
    Picture 1A
    H0 = 66,778
    1/H0 = 14,673
    Omega(Lambda)=0,81013
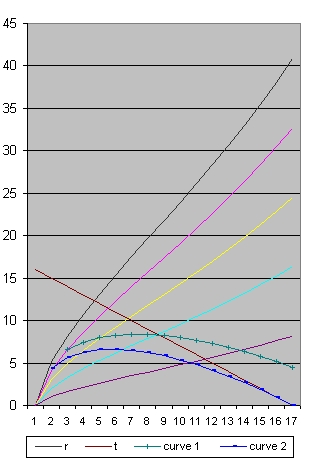
    Picture 2A
    H0 = 63,211
    1/H0 = 15,501
    Omega(Lambda)=0,90413
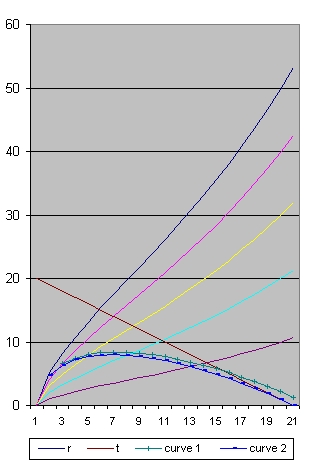
    Picture 3A
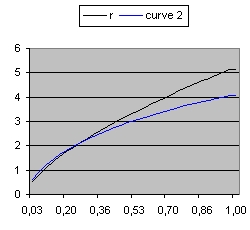
    Picture 1B
    age=14
    Picture 2B
    age=16
    Picture 3B
    age=20
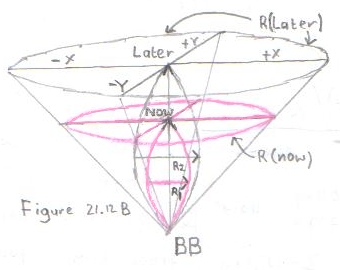
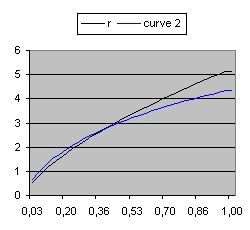
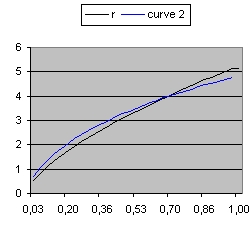
    The top three pictures above show the size of the Universe in the x direction with Lambda = 0.01129 when the parameter age has the values: 14 16 and 20.
    The bottom three pictures above show the detail for the first 1 billion years.
    Picture 1A shows the situation where H0=70 Mpc, 1/H0=14 Omega m=0.262 and omega L=0,737 which are the values close to what is presently measured or calculated.
    The most important lines are:
    1. The black line. This line shows the size of the Universe. This is the maximum distance from which something can be observed.
    2. The pink line, This line shows events at 1/5 of the radius of the Universe.
    3. The blue line. This line shows the path of a light ray which started as close as possible near the Big Bang and which reaches the Observer at present.
    4. The green line. This line shows the path of a light ray which started at the pink line 2 billion years after the Big Bang.
    The area above the blue line identifies events (For example super nova's) which will reach the observer in the future. The green line is an example of such an event.
    The area below the blue line identify events which reached the observer in the past.

    When you compare the three smaller pictures you will see that the starting events moved towards the right. They happened respectively 300000, 500000 and 700000 years after the Big Bang. The Black line in all the three pictures means the same.
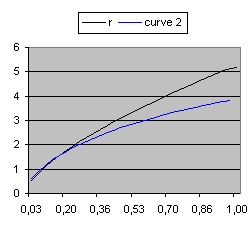
    Picture 3B shows all the events starting 700000 years after the Big Bang until present which is 20 Billion years after the Big Bang.
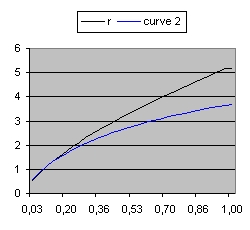
    Picture 2B shows all the events starting 500000 years after the Big Bang until present which is 16 Billion years after the Big Bang.
    Compare picture 3B with picture 2B than the events between 500000 years and 700000 years disappeared but new events between 16 billion years and 20 billion years appeared.
    The galaxies between 1 billion years and 16 billion years (which are visible on both) aged.

    In short, in total: you can observe more

    H0 = 61,324
    Omega(Lambda)=0,96065
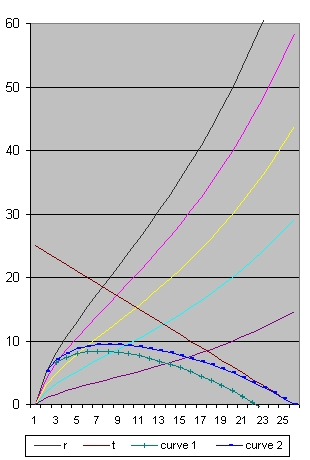
    Picture 4
    age=25
    H0 = 60,588
    Omega(Lambda)=0,98413
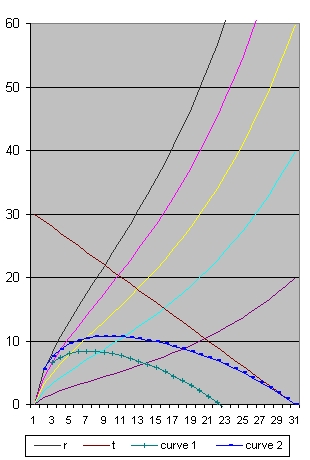
    Picture 5
    age=30
    H0 = 60,182
    Omega(Lambda)=0,99746
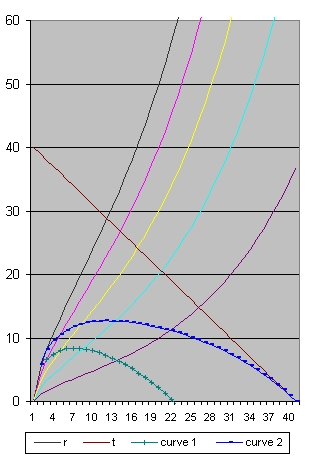
    Picture 6
    age=40

    To study this aging in more detail go back to Picture 1A
    • In Picture 1A the Blue line starts at the Pink line. It is the Pink line which we will follow. The Pink line represents the path of a galaxy. In this galaxy we observe for example a super nova
      In Picture 1A this super nova happens after 1 billion years at a distance from roughly 4 billion light years.
    • In Picture 2A we study the point where the blue line crosses the pink line. This is after roughly 1.4 billion years at a distance from 5 billion light years.
    • In picture 3A the point where the two lines cross is after roughly 2 billion years at a distance from 7 billion light years.
    • In picture 4 the point is at 2.5 billion years at a distance from 8 billion light years
    • In picture 5 the point is at 3 billion years at a distance from 9 billion light years
    • In picture 6 the point is at 4 billion years at a distance from 10.5 billion light years
    In this particular case the aging is called "little"

  2. Lambda = 0.06   C = 60   k = 0

    The corresponding pictures below have the same age, but Lambda is different.
    When you study the pictures 7B, 8B and 9B the starting events are 150000, 200000 and 250000 years after the Big Bang. This means almost nothing disappears from view and almost only new events appear.
    What is also important that the point where the blue line crosses the pink line, happened 1 billion years after the Big Bang at a distance of 4 billion light years. This point almost does not move. There is no aging.

    The behaviour of the green line for Lambda=0.06 is rather spectacular compared with Lambda=0.01129
    • With Lambda=0.06 this specific event is not observed. In that case the green line does not cross the horizontal time line. The reason is acceleration.
    • With Lambda=0.0129 this specific event is observed. That is the moment when the green line crosses the horizontal time axis. This is after roughly 22 billion years.

    H0 = 139,2804
    Omega(Lambda)=0,98953
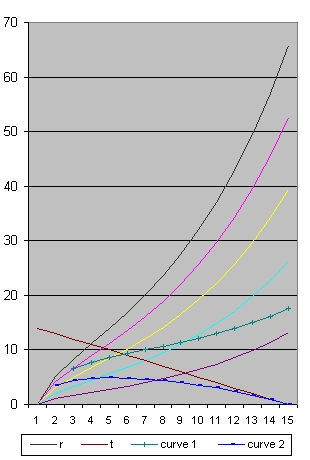
    Picture 7A
    H0 = 138,8619
    Omega(Lambda)=0,99551
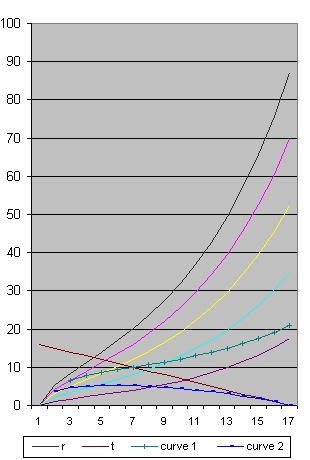
    Picture 8A
    H0 = 138,6068
    Omega(Lambda)=0,99918
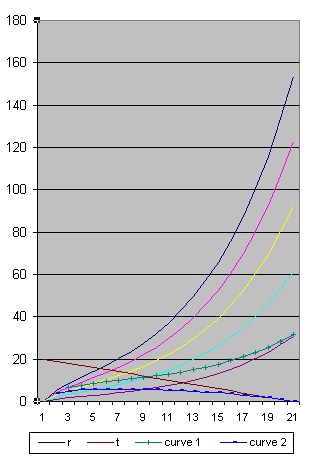
    Picture 9A
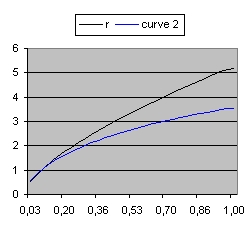
    Picture 7B
    age=14
    Picture 8B
    age=16
    Picture 9B
    age=20

    H0 = 138,5565
    Omega(Lambda)=0,99990
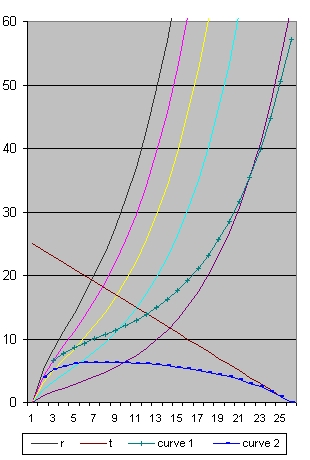
    Picture 10
    age=25
    H0 = 138,5505
    Omega(Lambda)=0,99999
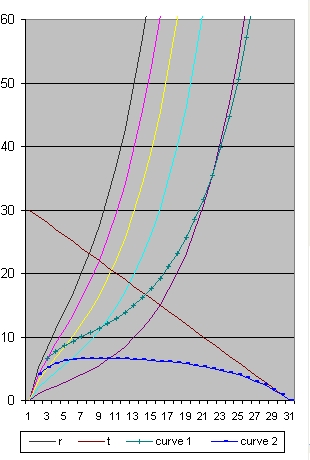
    Picture 11
    age=30
    H0 = 138,5497
    Omega(Lambda)=1
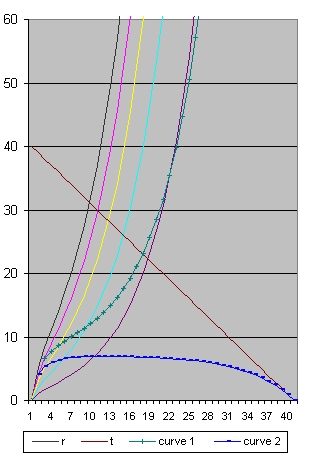
    Picture 12
    age=40

  3. Lambda = 0

    With Lambda is zero two different values of C are considered.
    1. With C = 60. This is the same value as discussed above
    2. With C = 2

    C = 60

    There are two ways to evaluate the Figures 13-15.
    • When you compare the figures among each other you will see
      • In picture 13 (age 14 Year) the oldest galaxies you can observe is roughly 0.5 years after the Big Bang.
      • In picture 14 (age 20 Year) the oldest galaxies you can observe is roughly 1 years after the Big Bang.
      • In picture 15 (age 40 Year) the oldest galaxies you can observe is roughly 4.5 years after the Big Bang.
      That is the point where the blue line crosses the black line.
    • You can also compare Picture 13 with Picture 1A (Both age 14 b years) and Picture 15 with Picture 6 (Both age 40 b years) and study the influence of the parameter Lambda.
      • In picture 1A (age 14 Year) the oldest galaxies you can observe is roughly 0.5 years after the Big Bang.
      • In picture 6 (age 40 Year) the oldest galaxies you can observe is roughly 2 years after the Big Bang.
      What that means for higher values of Lambda you can see much older galaxies.
      When you compare Picture 15 with Picture 6 this result is even more pronounced.

    H0 = 46,646
    Omega(Lambda) = 0
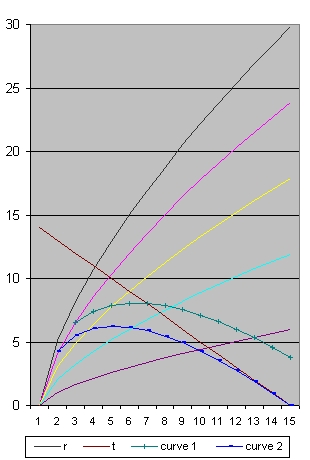
    Picture 13
    age=14
    H0 = 32,665
    Omega(Lambda) = 0
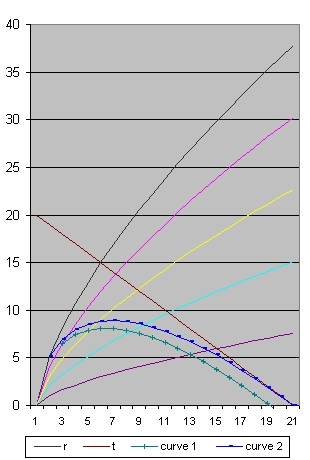
    Picture 14
    age=20
    H0 = 16,329
    Omega(Lambda) = 0
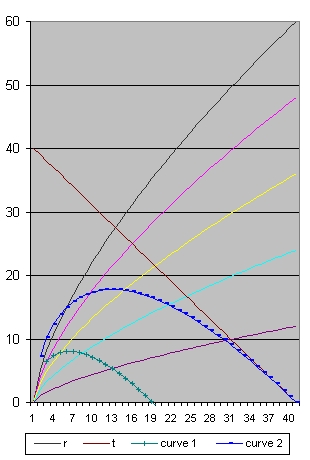
    Picture 15
    age=40

    C = 2

    There are two ways to evaluate the Figures 16-18.
    • When you compare the figures among each other you will see
      • In picture 16 (age 14 Year) the oldest galaxies you can observe is roughly 6.5 years after the Big Bang.
      • In picture 17 (age 20 Year) the oldest galaxies you can observe is roughly 10 years after the Big Bang.
      • In picture 18 (age 40 Year) the oldest galaxies you can observe is roughly 23 years after the Big Bang.
    • You can also compare C = 2 with C = 60
      In that case the galaxies you can see are the same but the age in C=2 is older.

    H0 = 46,654
    Omega(Lambda) = 0
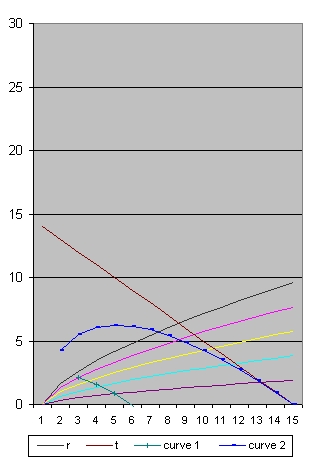
    Picture 16
    age=14
    H0 = 32,659
    Omega(Lambda) = 0
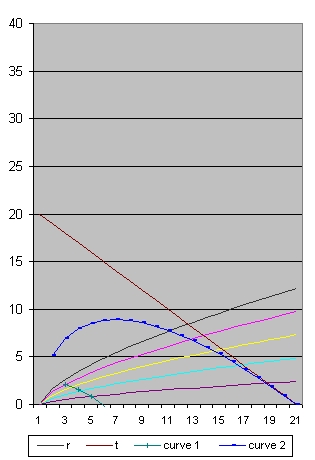
    Picture 17
    age=20
    H0 = 16,330
    Omega(Lambda) = 0
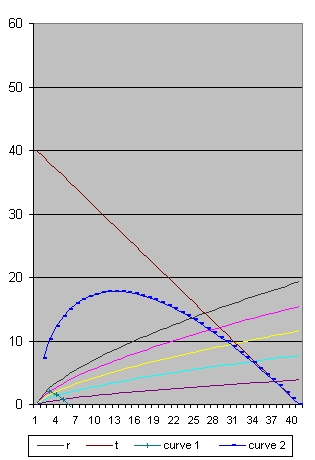
    Picture 18
    age=40
    The difference between C=2 and C= 60 is the black line, which represents the radius of the Universe. With C = 60 you can observe much deeper in the past. You can also use C = 120. In the case you can see the Big Bang assuming age = 14. The issue is if that corresponds with the real observations. If it does not than C=120 is too large.

Consider a sphere in space with a fixed radius. As a consequence of space expansion the number of galaxies within that sphere will diminish. When space expansion is accelerating this number will even decrease even faster. This is a density problem and is important for the local region of the Universe surrounding us.
What we are discussing here is the age of the youngest galaxies we can observe. Generally speaking the age of the youngest galaxies will slowly increase but the total number of galaxies we can see will stay the same assuming our own galaxy will still exist.
A second complexity is a Luminosity problem. The Luminosity problem has to do how long we can observe the youngest galaxy. This has nothing to do with the present position of the galaxy nor if space expansion is accelerating. The Luminosity problem is a function of the light travel time i.e the distance between the present time and the age of the youngest star. As a result the light received will be dimmer and the galaxy will become invisible assuming we use the same equipment. In short: the total number of galaxies observed on the long run will decrease

To read more about the pictures see: Friedmann's equation & the path of a light ray 13 Questions


2. Cosmography of the Local Universe

For the most current image of the positions of the galaxies see this: 3-D map of Universe shows galaxies in unprecedented detail The video is brilliant, is an eye catcher and gives a good impression about the current state of science and astronomy.
It should be mentioned that the distances involved are "small" relative to the total size of the Universe.

The document that gives background information is this: Cosmography of the Local Universe. The biggest problem is that almost nothing is discussed about dark matter while 85% of all matter in the Universe is supposed to be dark matter. This gives the impression that the authors of the article don't believe in dark matter.
In the document we read:
The simple question can be asked if the distribution of observed galaxies and the distribution of matter inferred from galaxy motions agree.
This question is simple but the answer is difficult.
The question is related to observed galaxies. In the document Low Luminosity galaxies are discussed. However also dark matter has to be considered because it influences the behaviour between galaxies and galaxy clusters, in the same manner as dark matter influences the rotation (curve) of each individual galaxy.
In principle you can follow two routes:
  1. First, based on the observed luminosities you can calculate the luminosity_masses of the galaxies.
    Secondly, based on the observed redshifts you van calculate velocities and the velocity_mass distribution responsible for this.
    Finally you can compare the distribution of luminosity_matter with the distribution of velocity_matter.
  2. First, based on the observed luminosities you can calculate the luminosity_masses of the galaxies and the luminosity_velocities in between these galaxies.
    Secondly, based on the observed redshifts you van calculate redshift_velocities.
    Finally you can compare the distribution of luminosity_velocities with the redshift_velocities.
The reason why this is very difficult is because if you want to compare behaviour (positions) you have to study the objects involved for a long time period. This is almost impossible when large galaxies are involved except when you have one large galaxy surrounded by dwarf galaxies
If you want to calculate the mass of the Black hole in the center of the Milkyway you have to evaluate the stars that rotate around this Black hole for generally speaking one revolution.
As such it is for example very difficult to do both type of comparisons for the Andromeda galaxy and the Milky way. The major problems here are the axial velocities.

The subject of what is observed is also discussed in the following two newsgroups:


2.1 Reflection "Cosmography of the Local Universe"

In the video and the document Cosmography of the Local Universe the concept of dark matter meaning non baryonic is barely discussed. This seems strange because of all the matter in the universe 85% is supposed to be non baryonic.
In order to investigate what others have to say about this subject the following documents are studied.
  1. Formation and rotation of disc galaxies with halos (1980)
    The first sentence reads:
    We consider a picture in which disc galaxies formed from collapsing gas in extended haloes of dark material.
    At page 190 we read:
    Mestel derived rotation curves for the discs resulting from the collapse of gas clouds with several different distributions of mass and angular momentum.
    At page 190 we read:
    "dark material consists of low-mass or burnt-out stars that formed before most of the presently observable stars"
    The word baryonic is not mentioned in this document.
    The picture emerged that in 1980 part of the matter in a galaxy was considered invisible but that there was enough baryonic matter available to explain flat galaxy rotation curves. Non-baryonic matter was not an issue in 1980.
  2. A revised model for the formation of disk galaxies: Low spin and dark halo expansion. By A.A. Dutton 1 January 2007
    This document starts with the following sentence:
    In the standard, cold dark matter (CDM) based model for disk galaxy formation, set out by Fall & Efstathiou (1980), galaxy disks form out of gas that slowly cools out of a hot gaseous halo, associated with the dark matter potential well, while maintaining its specific angular momentum.
    At page 27 we read:
    "Consequently, the structure and dynamics of disk galaxies are expected to be strongly correlated with the properties of their dark matter halos"
    At page 32 we read:
    We define the baryonic mass of the total galaxy as :
    Mgal = Mdisk + Mbulge
    At page 33 we read:
    When baryons cool and concentrate in the center of a dark matter halo.
    At page 47 hot and cold baryons are mentioned. Also at that page Omega(m) = 0.3 and omega(Lambda) = 0.7

    This document uses the word "dark matter" 40 times, baryonic 41 times, baryons 36 times and the word non_baryonic zero times.
    The picture emerges that in this document dark matter is considered baryonic and that non-baryonic matter is not an issue.

  3. The Extragalactic Distance Database: all digital Hi profile catalog By H.M. Courtois 2009
    In this document we read:
    If the Hi gas is in equilibrium in a disk, rotating in circular orbits, then there is a simple relationship between the observed motions and the distribution of mass. The small dispersion in the relation between rotation rate and luminosity implies a strong correlation between the dark matter that dominates the potential and the baryonic matter that shines.
    Etc. That is all about dark matter and baryonic matter.
  4. Cosmic Flows surveys and CLUES simulations By H.M Courtois and R.B. Tully March 2012
    In the Introduction we read:
    Structure has formed due to gravitational collapse driven by dark matter. It appears that today repulsive dark energy has gained ascendancy over dark matter, leading to the termination of collapse on large scales. The goal of this program is to contribute to an improved and accurate understanding of dark matter and dark energy.
    Next we read:
    the CMB informs us that our Galaxy has a deviant motion of 630 km/s in a well defined direction. The preferred assumption is that we are being attracted by a lot of dark matter, but we do not know by how much, and how far away it is.
    This seems to be based on document (1) the Great Attractor. Next we Read:
    The radial component of the ‘peculiar velocity of an individual galaxy ( =Vpec ) can be determined if we know a good distance ( =d ) for the galaxy since the (easily established) observed velocity of the galaxy (=Vobs) is the sum of the peculiar velocity and a cosmic expansion component ( =H0*d) where H0 is the Hubble Constant: Vobs = H0 * d + Vpec.
    The Hubble Constant can be established by averaging over a sufficiently large and distributed sample with distances for which < V pec >= 0.
    I expect that < V pec > = 0 means that the summation of the Vpec's of all the galaxies is zero.
    How do you know that ?
  5. The mid-infrared Tully-Fisher Relation: calibration of the SNIa scale and H0 By J.G. Sorge R Brent Tully and H.M. Courtois 17 August 2012
    This document starts with the sentence:
    Type Ia supernovae (SNIa) have remarkable properties such as their high luminosities (10^9 L0) and their apparent homogeneous nature. Kowal (1968) established the first Hubble diagram that suggested SNIa could be used as extragalactic distance indicators.
    Next we read:
    Our collaboration has recently contributed to the establishment of the SNIa scale (Courtois & Tully 2012) primarily using constraints imposed by using distances acquired with the correlation between the luminosities and rotation rates of galaxies (Tully & Fisher 1977), the Tully-Fisher relation (TFR).
    The concept of dark matter is not mentioned.
  6. Anatomy of Ursa MajorisBy I.D.Karachentsev, O.G.Nasonova, H.M. Courtois 7 September 2012
    This document is an earlier version (predecessor) of document #8
    In the abstract we Read:
    A possible explanation for this is that most mass in the Universe lies in the empty space between clusters
    Next:
    This cloud consisting of several virialized groups shows fast non-Hubble motions with amplitude of approx. 700 km /per sec. Such motions can be caused by the expansion of the large cosmic void between the Coma and Virgo clusters, or by the presence of a massive Dark Attractor located in the Coma I region of approx 15 Mpc away from us.
  7. Updated Nearby Galaxy Catalog by Igor Karachentsev March 2013
    This document is an earlier version (predecessor) of document #8
    Figure 1 in this document is interesting because it shows how difficult it is to measure H0 based solely on local observations.
    At page 23 we read:
    In cosmological models, describing the structure of dark galaxy halos, the central density of matter is presumed to be the same regardless of size and mass of the halo
    At that, the mass and size of the halos are related as M(DM) = R^3. If the distribution of stellar matter follows the distribution of dark matter,
    Etc. That is all about dark matter.
  8. Cosmography of the Local Universe By H.M. Courtois 13 June 2013
    At page 1 of the document we read:
    The simple question can be asked if the distribution of observed galaxies and the distribution of matter inferred from galaxy motions agree.
    This is not a simple question. What is at stake is not only the distribution but also a quantitative analysis of the amount of matter involved.
    At the end of page 1:
    Our markers are galaxies. We measure crude three-dimensional (3D) locations from their systematic velocities and sky positions (distorted from true positions by peculiar velocities) and we can estimate their baryonic masses from their luminosities
    That is correct but that is not the total picture. Galaxies (are supposed to) consists of hot baryonic (visisble) matter, cold baryonic (Invisible) matter and non-baryonic matter. All these types of matter should be discussed.
    At page 8 we read:
    The agreement between the two distinct descriptions of the distribution of matter (one from redshift surveys and the other from peculiar velocity studies) is a non-trivial result.
    I agree with this. However also a quantitative matter analysis is required.

When you study the above 8 documents in local universe evolution and in galaxy evolution only baryonic matter (gas) is considered.
The halo is considered dark, but dark in the sense of invisible dark baryonic matter. In our local region of the universe the same situation is assumed, that means almost all matter is considered baryonic. The picture emerges that there is a group of astro physicists who silently agree that there is almost no non-baryonic matter in our local universe

When you read the WMAP documents a different picture emerges. WMAP studies the CMB radiation and the total universe since the Big Bang. The result is that 85% of all matter is non-baryonic.

Those two angles of research are in conflict with each other because if in the local universe the amount of non-baryonic is small than the amount of non-baryonic matter in the rest of the universe should be higher than 85% in order to reach the average value of 85%.
This is highly unlikely


3. "Cosmology: the science of the universe" Edward Robert Harrison (2000)

For a preview of the book select: Front page


3.1 Reflection "Cosmology: the science of the universe"

  1. Figure 21.10 and Figure 21.12 are both misleading.
    The problem is that it is a mixture between what happens in the x,y plane and the time axis in one plane. The time axis should be drawn perpendicular to the x,y plane. The x,y plane should be horizontal and the time axis vertical.
    The mixing of the x,y plane and the time axis is "dangerous".
  2. In order to explain the particle horizon and the event horizon the text starts with a static universe. That means you explain something starting from a situation we assume that does not exist.
    When you study the light curves in Figure 21.10 and Figure 21.12 they are bended. The vertical axis is the time. The farthest we can see is the maximum distance in the horizontal direction assuming that both axis are in light years.
  3. IMO the whole concept of particle horizon and event horizon should be evaluated. The only thing that is important in figure 21.10 and figure 21.12 is the light curve starting from the BB and going to the observer. This line represents a sequence of events and is a function of the cosmological parameters C (rho) Lambda k and age of the Friedmann equation.
    The most important question to answer is if it always possible to observe the Big Bang (or very close to the BB)
  4. Concepts like particle horizon and event horizon are typical human based and are not directly necessary to understand the physical reality and how the universe evolves.
    The universe is supposed to be isotropic and homogeneous implying that the universe was and is everywhere the same from the BB until now. That does not exclude a sense of evolution and changes in complexity except that these changes should have happened everywhere general speaking at the same epoch.
  5. Consider a similar planet civilisation, like our earth population, presently somewhere in the Andromeda Galaxy.
    The people on that planet should have discovered something what we call the CMB radiation.
    They should also have discovered the same equation which we call the Friedmann equation and the parameters should be the same as we have calculated based on our observations. That means Omega(Lambda) = 0.73 and the age of the universe is roughly 13.7 b years old.
    The issue is if their universe is the same as our universe. IMO the answer is yes. Their universe includes exactly the same galaxies as our universe. That does not mean we exactly observe the same universe because the distance towards each galaxy is generally speaking different. We will observe each galaxy at a different moment (age or state) as they do.


4. Visual horizons in World-Models

This document discusses the article "Visual Horizons in world-models" by W.Rindler. 1956
To read the original document select: Visual horizons in World-Models
At page 663 the document reads:
We shall define a horizon as a frontier between things observable and things unobservable
Immediate the question arises: How important is this concept?
What we want to understand and know is the present state of the universe, what happened before and what will happen in the future. All what we observe happened in the past. The reality is that of all that has happened we can only observe a very tiny bit. The farther away the earlier however also the less clear, partly because an image of one event (object) can be distorted by an other object. This implies that the boundary of what can be observed versus what can not be observed in the reality can be fuzzy.
It may de defined as follows: An event-horizon for a given fundamental observer A is a surface in space-time which divides all events into two non-empty classes: those that have been, are, or will be observable by A and those that are forever outside A's possible powers of observation.
This is a rather subjective definition. The issue is not so much to define an event-horizon but the region in space (as a function of time) of events we can observe and the events we can not observable at present (excluding the fuzzy issue)
It may de defined as follows: A particle-horizon for a given fundamental observer A and cosmic instant t0 is a surface in the instantaneous 3-space t=t0 which divides all fundamental particles into two non-empty classes: those that have already been observable by A at time t0 and those that have not.
When you compare the text the two definitions are rather different in detail. In a sense they are also rather difficult and open for different interpretations.
In reality all the particles we can observe and all the events we can observe are the same because all events involve particles (photons) and the observation of a particle is an event.
The general mechanism of horizons can be simply illustrated by means of the well-known "reduced" model which represents the universe as an expanding balloon.
This analogy is tricky because we do not live on the "surface" of a balloon.
Photons can be represented by red dots moving over the balloon along great circle paths and always at constant speed relative to the material of the balloon. An event-horizon will exist for A and similarly for all other fundamental observers in models where the rate of expansion is and remains sufficiently great for some of the red dots moving on great circles towards A never to reach A.
I do not understand this.
What we can observe at present depends partly on the position of the event in space at the moment of the event and partly on the path of the photons through space towards the observer. To explain this by means of a surface of a balloon does not seems accurate. IMO you need the Friedmann equation to calculate what actual can be observed.
On the other hand a particle-horizon will occur if for example the balloon is blow up from a volume approximating to a point at an initial rate exceeding the speed of the red dots, so that a finite time will elapse before any given one of them can reach A.
Sorry, again I do not understand.
At page 668 we read:
Evidently the necessary and sufficient condition for this type of model (R(t)=a*t^n) to have an event-horizon is n>1. Consequently the Einstein-de Sitter model, Dirac's model and Milne's model do not have an event-horizon.
That means only Page's uniformly accelerated model (n=2) has an event-horizon.
Further: No comment. At page 669 (center) we read:
As R(t) is by its nature positive and finite,
Interesting statement. See also at Reflection "Visual horizons in World-Models".
Next we read:
Phi(t) is an increasing function of t when it exists, and thus, by equation 11, more and more particles become visible to A as time goes on, etc.
This is true for small values of t. The issue is if this is true for all world models. At page 670 we read:
Thus a particle B becomes visible to the particle-observer A the moment it enters A's creation-light-cone.
Figure 2 at page 571 shows this situation.
This is the earliest moment we can observe particle B. i.e. at the Big Bang.
What is not shown in figure 2 that if you take t1>t0 and you draw the light path through that point, that light path will cross the worldline through B. That means you will observe particle B at a latter instant.
At page 670 (bottom) we read:
Thus in particular Milne's uniformly expanding model (n=1) and Page's uniformly accelerated model (n=2) do not possess a particle-horizon, whereas Dirac's model (n=1/3) and the Einstein-de Sitter model (n=2/3) do possess one
That means Milne's model (n=1) has neither.
To study Milne's model read this: Milne's model
At page 671 we read:
As an example of a model-universe possessing both a particle-horizon and an event-horizon I shall choose a model which has k=0 and a positive cosmological constant etc. This model is somewhat similar in general to the better known Lemaitre model. etc and is seen to approximate asymptotically to the Einstein-de Sitter model for small values of t and to the de Sitter model for large values of t.
At page 672 we reed:
We need not here enter into the exact calculations for the light-paths.
In actual fact this is very important at least to study fig 3 for Omega(Lambda)=0.73 and k=0.


4.1 Reflection "Visual horizons in World-Models"

The Summary starts with the following sentence:
A horizon is here defined as a frontier between things observable and things unobservable.
The problem with this sentence is that the concept "observable" is typical a human quality and not a physical quantity.
Super novae 1A have the same Luminosity but the received magnitude depents about distance and if the Super novae is observed depents about the equipment used.
The next sentence reads:
Two quite different types of horizon exist which are termed event-horizons and particle-horizons.
An event is typical a Super novae. When the universe becomes larger it is possible that of two Super novae at the same distance but with different luminosities only one is observed. This creates a problem of what defines an event-horizon.
A particle-horizon, my understanding, is much more a physical horizon. Outside the particle-horizon there is only empty space.
A black hole is described by two "horizons". First you have the particle-horizon described by the physical object and secondly you have the physical event-horizon within which nothing is visible. Only events can be observed which happen outside this horizon.
  1. Figure 3 shows the worldlines of 3 particles: A (origin particle), B and C. The world line of particle C is the largest.
    The question is: is there a maximum particle M worldline? Could C be the maximum?
    Based on the fact that R(t) is finite the answer should be: Yes.
    The consequence is that if you draw the light path through a point t2>t0 at the time axis you should not cross the worldline through particle M.
    When this is the case for a certain point t2 the result is that the earliest event that can be observed is not the Big Bang but the moment that the light path crosses the particle M worldline.
  2. A different question is how important is the concept of particle-horizon and event-horizon.
    I do not think it is, specific if you want to know: What is the path of a light ray that reaches the observer at a specific moment t for a specific world model To answer that question you have to know the cosmological parameters and you have to solve the friedmann's equation.
  3. When you study Figure 3 you will see three light cones which start at the Big Bang and which make angles of 45 degrees with the world lines of the three particles A, B and C.
    IMO those light cones do not make much sense, specific the fact that the light cone for particle A is bended away from the horizontal axis.
  4. In Figure 3 the light cone of particle C (the farthest) has a line bending inside and one bending outside. If there is light outside than there are also particles outside C. That means worldlines which start at the Big Bang outside C
    You can use this type of argumentation ad infinite. But is that correct?

    It can not be that the area outside C is any different than the inside. If the area outside C is not empty than it belongs to the world model described by the function R(t). Within that area all space is homogeneous.


Back to: Friedmann's Equation & The path of a light ray 13 Questions
Back to my home page Contents of This Document
Created 7 December 2013
Modified 14 January 2014